Data Analytics Marketing

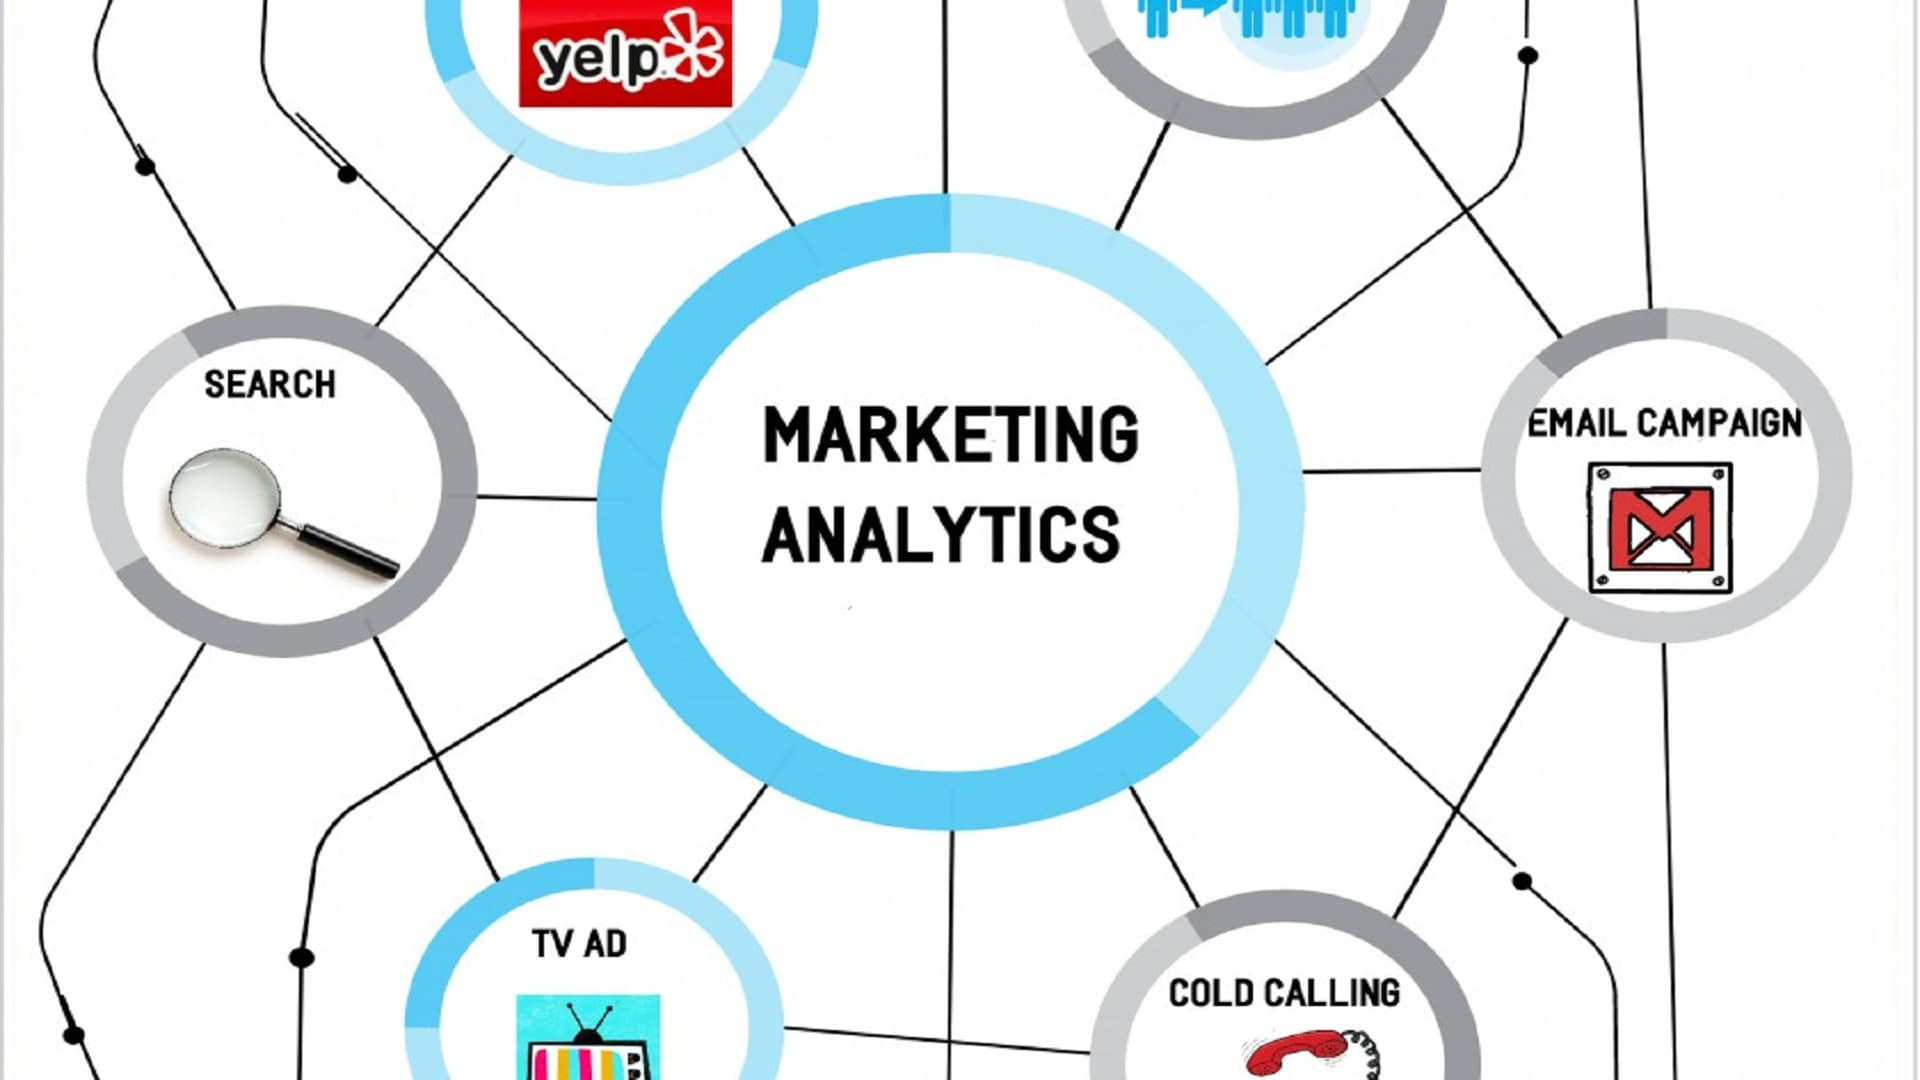
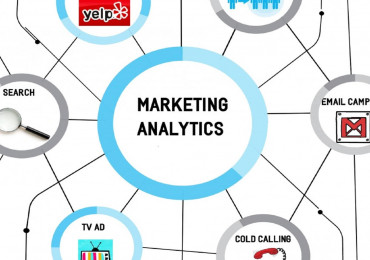
It is the use of data and statistics to analyze and understand customer behavior, identify marketing opportunities, and improve marketing strategies. This type of marketing relies on collecting data from multiple sources, such as websites and social media, to provide insights that support effective marketing decision-making.

Characteristics and characteristics of graphical marketing:

  1. Data-driven: Relies on actual data rather than assumptions to guide strategies.
  2. Predictive and forecasting: Uses graphical analysis to predict market trends and future customer behavior.
  3.  Campaign personalization: Allows marketing messages to be customized according to customer behavior and interests.
  4. Continuous evaluation and improvement: Helps measure campaign performance and continuously improve them based on results.

Benefits and features of graphical marketing:

  1. Improve customer targeting: Helps accurately identify the target audience.
  2. Increase return on investment: Contributes to improving campaign effectiveness and reducing unnecessary expenses.
  3. Informed decision-making: Provides accurate data that helps in making informed marketing decisions.
  4. Better understanding of the market: Helps in understanding market trends and needs more deeply.
  5. Enhance customer experience: Allows for personalized offers and services that increase customer satisfaction.

Disadvantages of analytics marketing:

  1. High cost: Requires advanced tools and specialized human resources, which increases costs.
  2. Complexity: Analytics can be complex and requires high technical skills.
  3. Data-dependent: The quality of the analysis depends largely on the quality of the data available.
  4. Privacy risks: Collecting and analyzing data may raise concerns about customer privacy.

Types of analytics marketing:

  1. Descriptive analysis: Focuses on describing what is happening in the market based on current data.
  2. Diagnostic analysis: Aims to understand the reasons for customer behaviors or campaign performance.
  3. Predictive analysis: Uses data and models to predict future trends and behaviors.
  4. Descriptive analysis: Recommends specific actions based on past analysis.
  5. Real-time analytics: Provides real-time insights and analytics for quick decision-making.

Examples of graph analytics marketing:

- Netflix: uses graph analytics to recommend movies and series based on viewers’ preferences.
- Amazon: relies on graph analytics to provide personalized product suggestions for each customer.

- Coca-Cola: uses graph analytics to understand customer preferences and develop targeted marketing campaigns.

Graph analytics marketing is a powerful tool for improving marketing performance and understanding customers more deeply. It can increase campaign effectiveness and reduce costs through more precise targeting and personalized messaging. Despite its costs and complexities, graph analytics provides great value for companies seeking to stay ahead of the curve and achieve tangible marketing results.